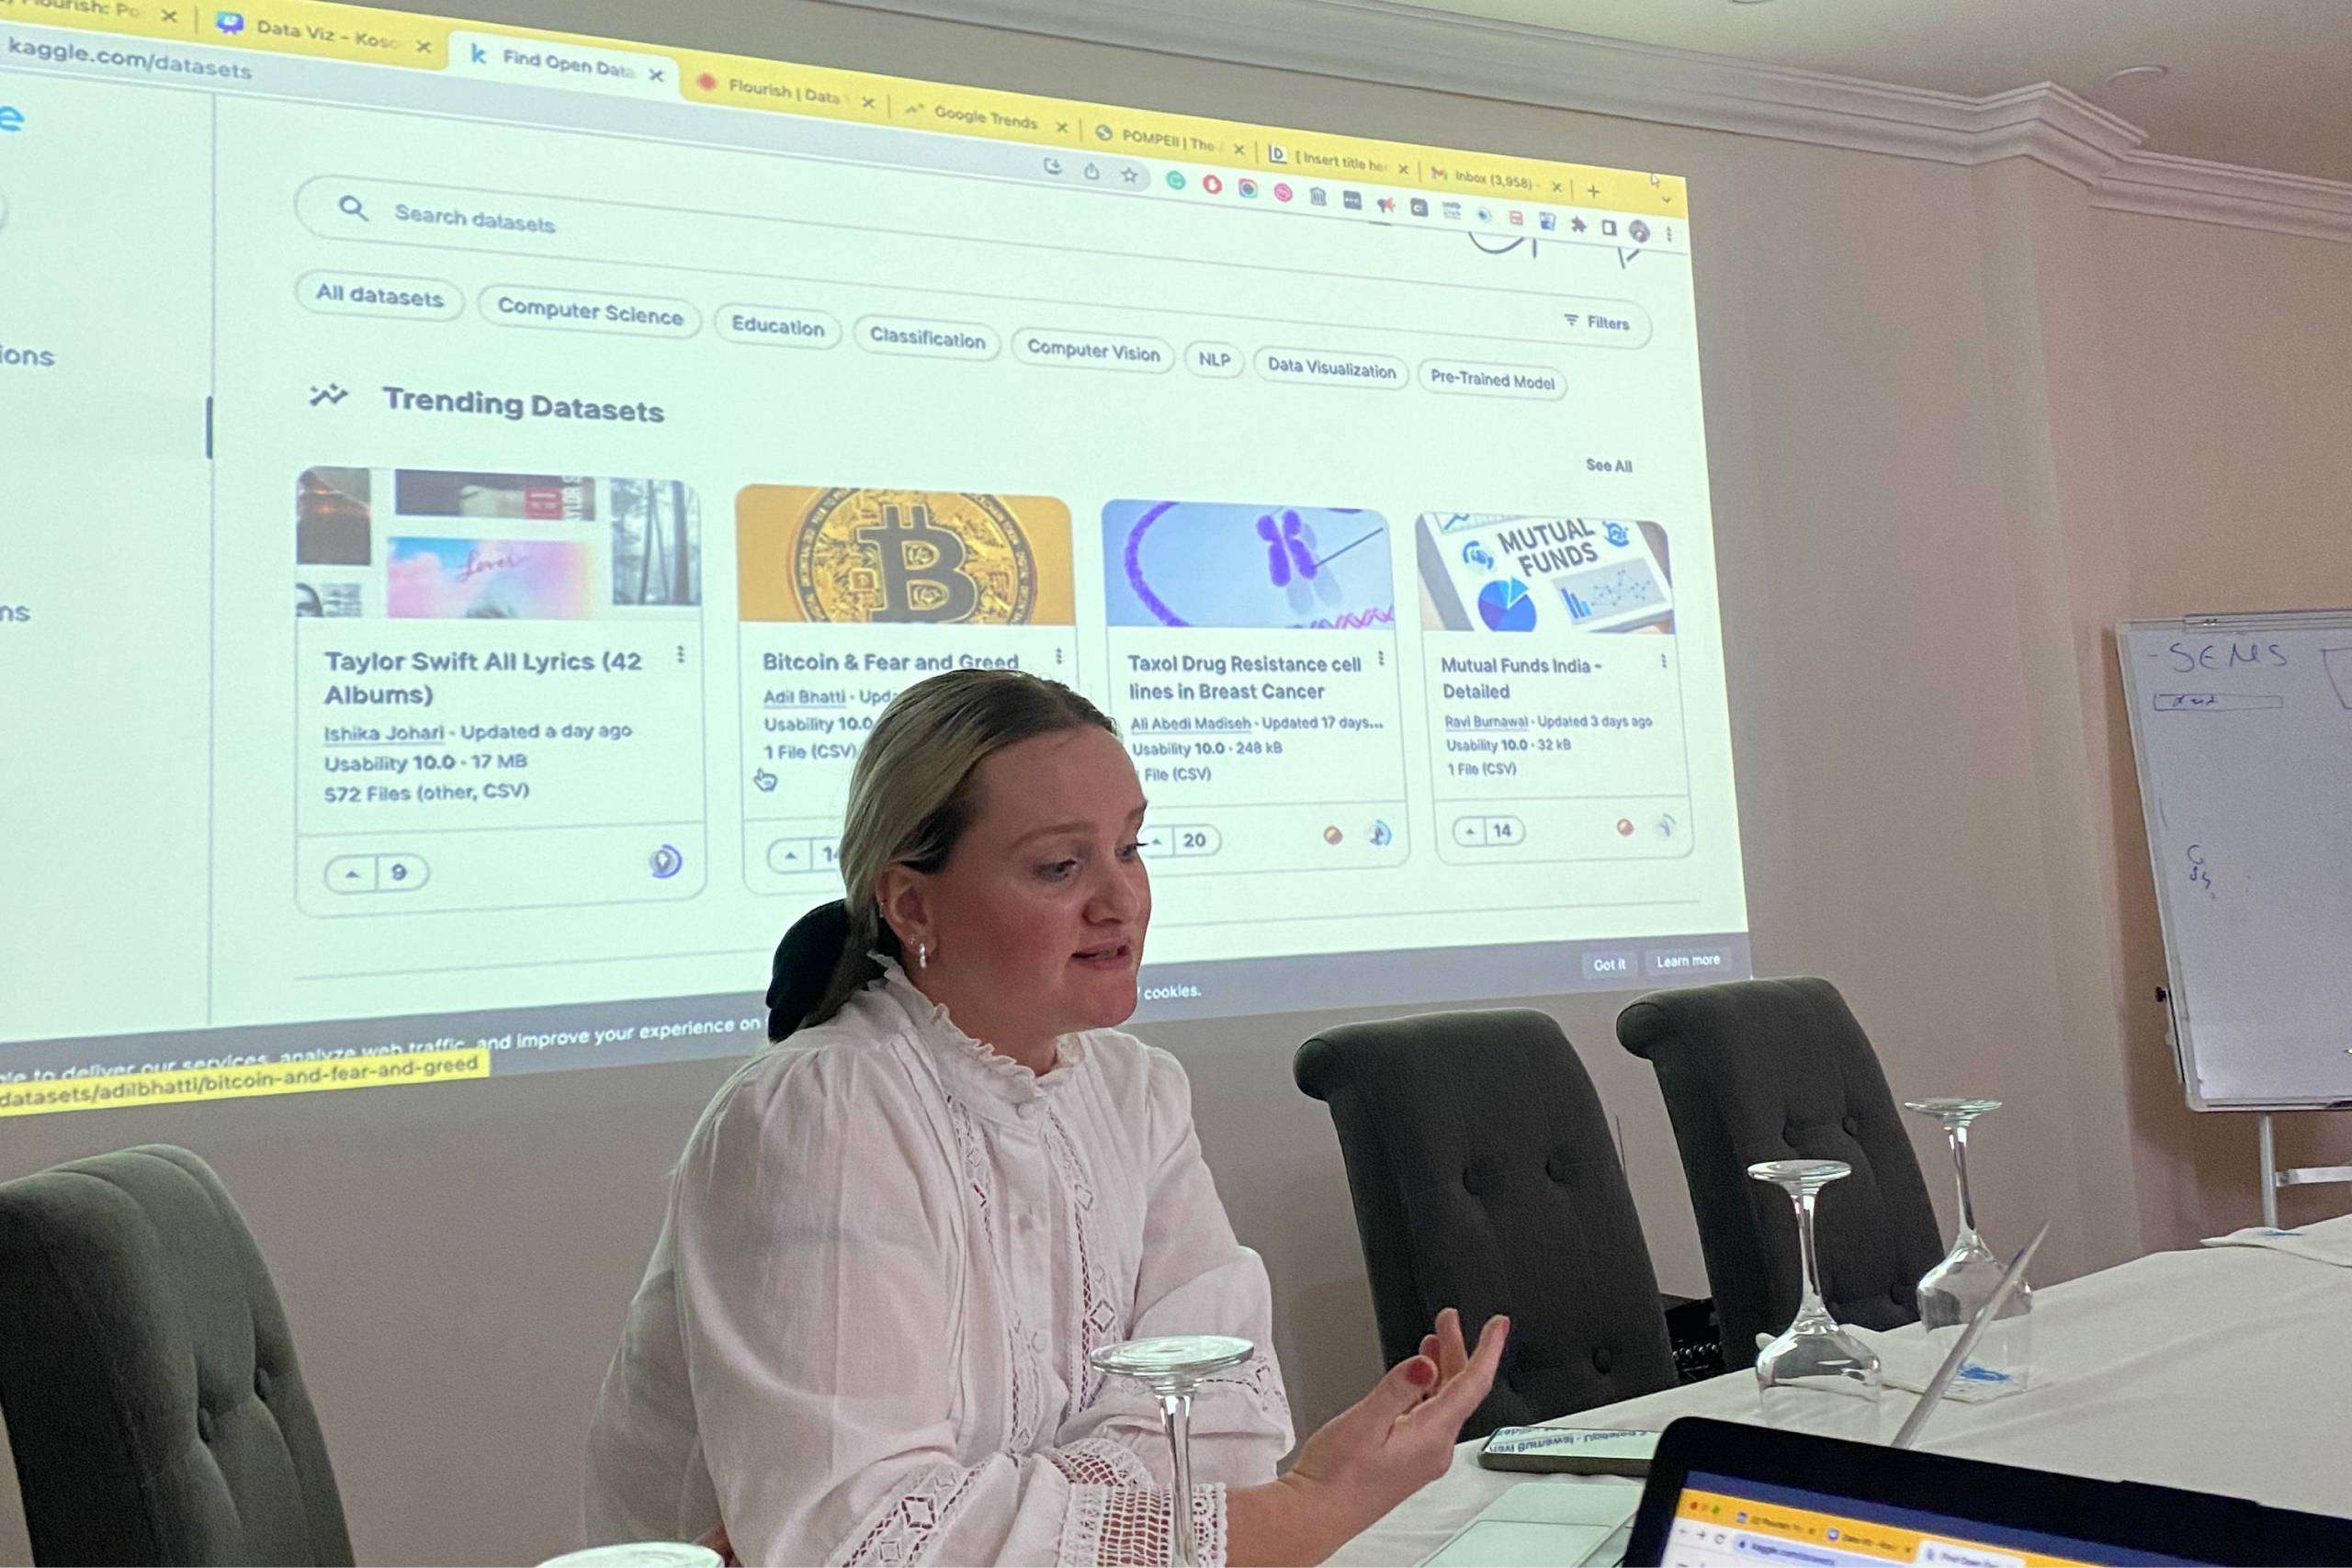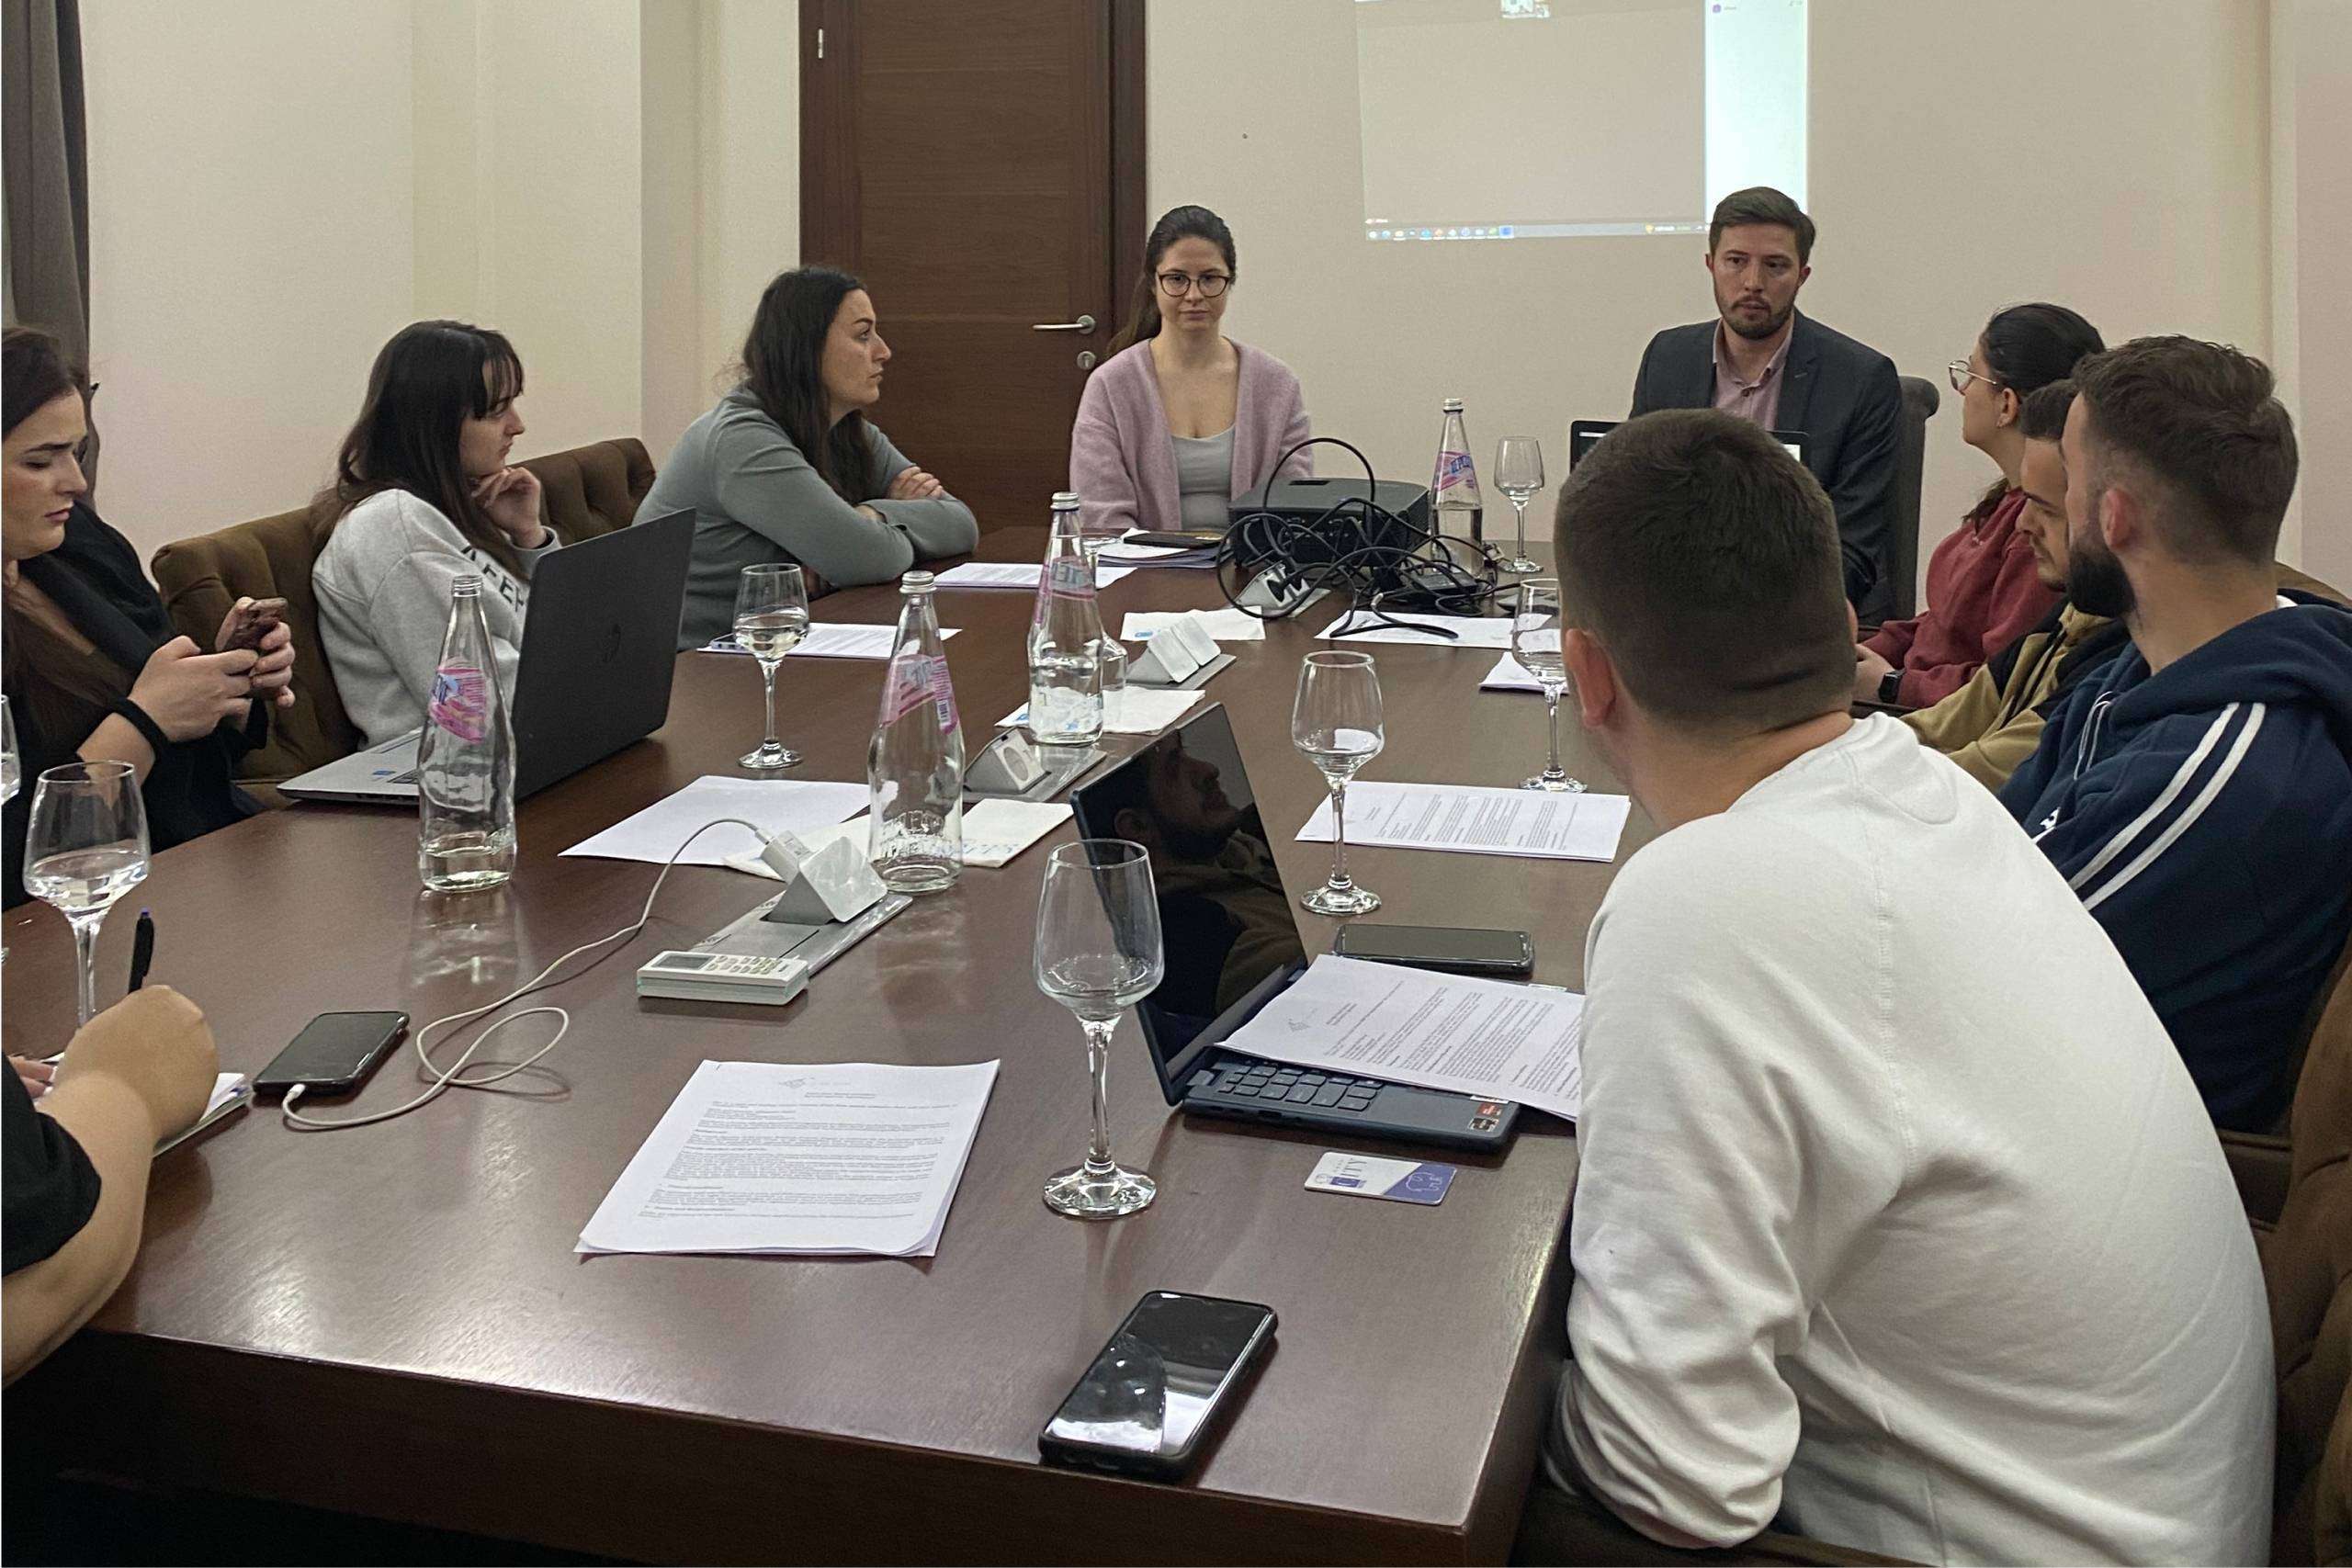
The ability to effectively present and visualize data is an essential skill for any researchers, especially in today’s world of information overload. The 3rd module organized in Prizren from April 28 to 30 for our 9 young researchers was focused on exactly this topic – Data Presentation and Visualization
Led by Anđela Milivojević, a BBC investigative journalist, the module provided the researchers with an opportunity to learn new techniques and tools for presenting and visualizing data in a way that is engaging, informative, and visually appealing.
The researchers were introduced to the basics of drawing diagrams and graphs, including best practices for selecting the right chart type and designing effective visualizations.
They also learned about the principles of mapping and data visualization software, which can be used to create interactive and visually appealing dashboards and reports.


On the last day of training, we had a kick-off session, where the researchers were paired with their preferred mentors, with whom they would work closely over the next three months while writing their policy briefs. This allowed the researchers to ask questions, clarify expectations, and set goals for the next three months.
The mentors also provided valuable feedback on the researchers’ initial ideas for their policy briefs, helping them to refine their focus and identify the most critical aspects of their research to highlight in their policy briefs.
This is part of the project “Strengthening Youth Civic Participation in Political Processes” implemented by New Social Initiative (NSI) funded by National Endowment for Democracy (NED).


